Visual Studio Tips & Tricks - Performance Analysis
In this post, I am going to introduce a new feature made it's debut in Visual Studio 2015, the diagnostic tools, which I will definitley help you to easily identify performance bottlenecks and issuees while developing apps using the most widely used IDE.
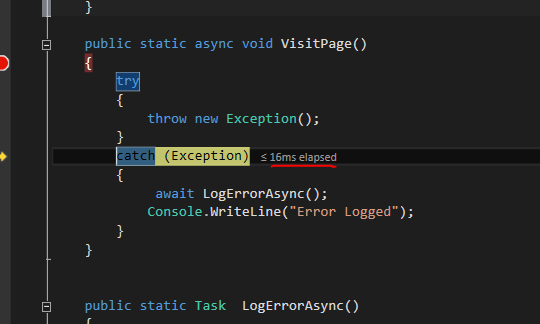
One new feature you are going to easily notify is that whenever you debug code in Visual Studio 2015, it will show the time eapsed right next to it as shown in the image below.
Time Values while debbugging
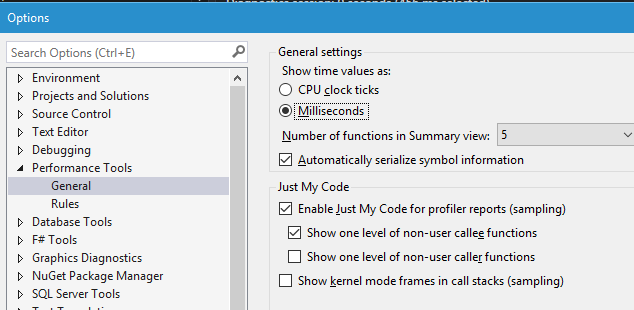
You can configure the type of information that needs to be shown from the options. You have the option to set either CPU clock ticks or Miliseconds. By default it's miliseconds.
Opening Diagnostic tools
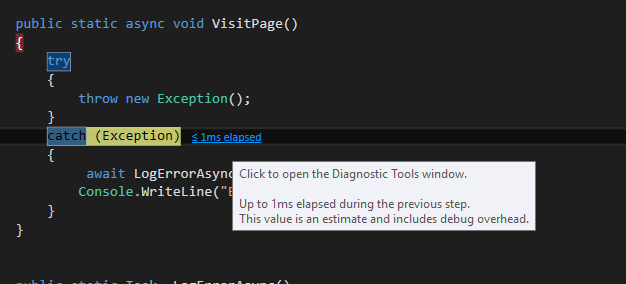
If you hover your mouse over the time value, it will show you a popup like the one below.
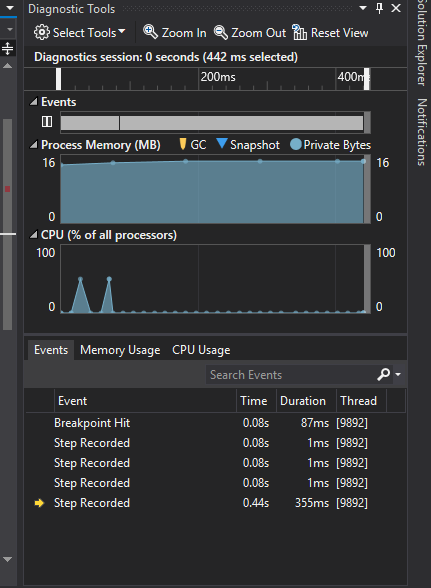
When you click on that, it will open the diagnostic tools in a window, which will have a lot of live information while your application is running like Process Memory Usage, CPU Usage, events etc. I will be covering it in detail in an upcoming post. In Visual Studio, it's enabled by default and whenever you run the application, it will be opened. So if you are coming from the earlier versions, you will feel that VS is taking some time to start the debugging. It's due to this and you can always turn this feature off from the options screen.
It can be turned on/off completely from here .Tools -> Options -> Debugging -> General -> Enable Diagnostics Tools.
If you want to start the tools without debugging, then use Alt + F2 to start debugging without diagnostic tools or from Debug -> Start Diagnostic Tools without debugging.
That's all for this post and please visit us ofter for more on VS Tips
No Comments
Connecting Azure Blob Storage account using Managed Identity
Posted 12/9/2022Securing Azure KeyVault connections using Managed Identity
Posted 11/26/2022Manage application settings with Azure KeyVault
Posted 11/9/2022Adding Serilog to Azure Functions created using .NET 5
Posted 4/3/2021Learn how to split log data into different tables using Serilog in ASP.NET Core
Posted 4/23/2020